📖 ARTICLE
The Feedback Board, a complement for user personas
Designed to help you keep survey data and interview feedback through production.
The story behind
I’m a newcomer in the world of UX Research and with time I have realized that it can become really challenging to refer back to our surveys and interviews findings as we go along in our project.
The user persona was created to close this gap and we use it to have a person of reference at any time. But I feel like the persona in itself doesn’t provide enough of what the actual feedback was.
In order to help me stay focus on the user’s voice. I have developed a tool to complete my persona with direct survey and interview results.
Benefits and Limitations
This tool will help you focus on the actual data from your survey and the words expressed by your interviewee. It could help you define the type of questions you should ask and help you go forward on your research.
However, this will not replace a persona and will make you highly dependent on your survey and interviews results.
If your research contains a bias it will engage your project even deeper in the wrong direction. This tool will limit your agility, if you need to change directions you will need to update the board in order to keep using it while your persona can stay the same.
If you are narrowing down your audience to a small segment of the population the feedback board is no longer needed. Your persona will then become the most accurate representation of our target.
The feedback board
How to use
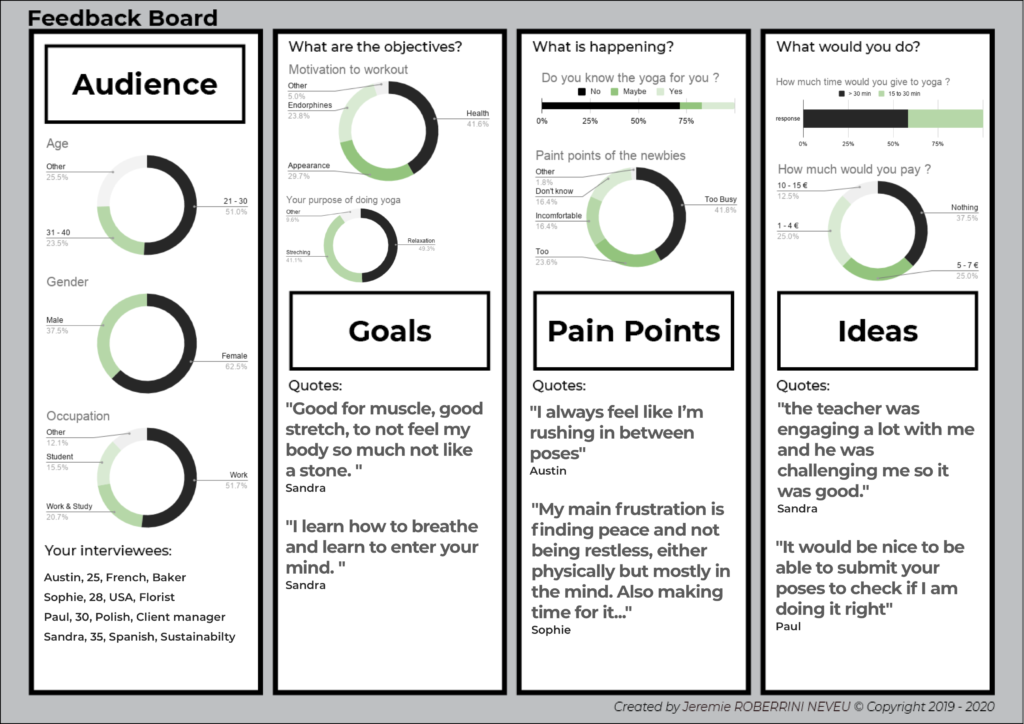
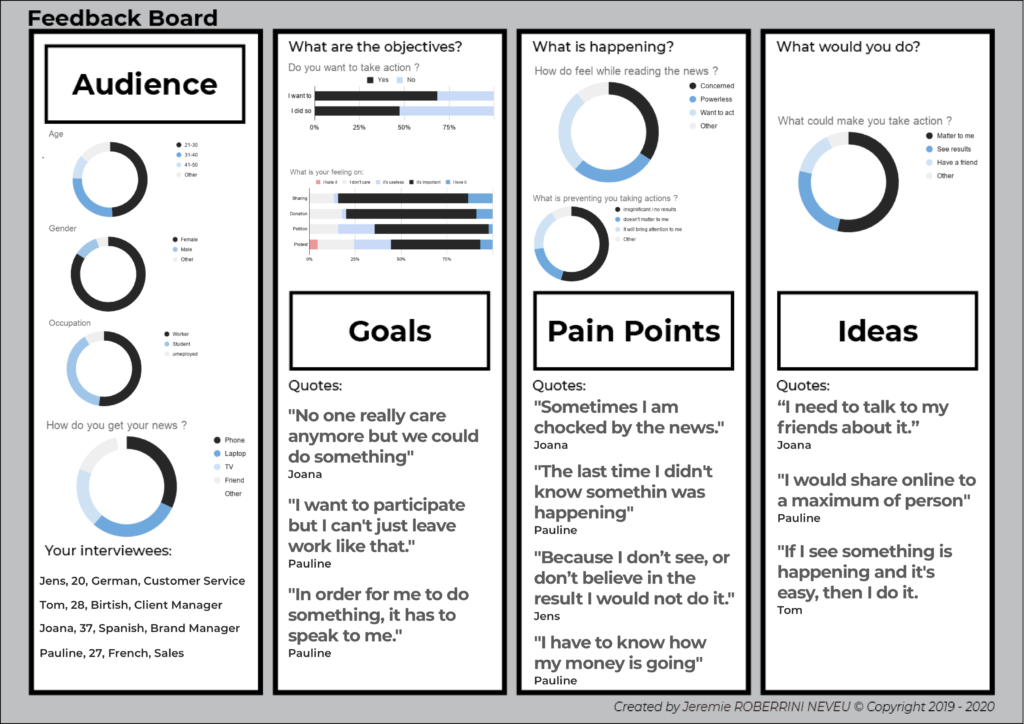
The board is made of 4 panels, each panel is made of 2 areas.
The top area is a space for charts and graphic representation. This area has limited space to contain your research to one or two graphics for each focus point.
The bottom area is made for the reporting of direct quotes from your interviews. These quotes are the voice of the user and are the most important part of this tool.
The goal is to use real information, not imaginary assumptions.
Audience
Who did you talk to in your research?
Your audience panel should be filled with the demographic information you have collected in your survey. I would recommend you to use a chart, but if you have decided to limit answers into a narrow population (ex: only Women) you should then replace the chart with a card indicating this is what we are focused on.
It is also nice to report some information from the people you have interviewed such as Name, Age, Profession, etc. This will help you connect with a real person while reading the Quotes.
Goals
In your context, what are people trying to achieve?
In your survey and interviews, aks questions about the actual motivation of your user. We often come to the stage with an assumption (such as: people buy this in order to do that), we need to get information from there point of view.
You can ask questions like: “what are your motivations?” for something they are currently doing or “What would be the purpose?” for something they want to do.
Paint Points
What are the problems people are dealing with?
This section is the one we are used to, the goal of UX is to solve peoples problem. And to solve a problem, we should know about it. For this part, you can ask open questions and let people enter a custom answer in your survey.
My advice for this would be to also attempt to verify your assumption, you can set up a multiple checkboxes answer with your assumption of what could be the problem in it and let the respondent also write the issue in their own words via another checkbox. And try to discard “time” as a possible answer to the problem.
Ideas
How would your users deal with there problems?
This section is not to turn your interview into a finding the solution quest. If you ask for the final solution to your people, you will either get something impossible or more of something that already exists.
The goal here is to understand the people mindset in the face of the problem. You are trying to see what they are willing to do and what do they think is a good solution. If you plan to have a paid product you can already ask how much someone would pay for a possible solution or how much time and effort they would invest in it.
Examples
Our usage of the board as a team for a yoga app.

We started our project with no assumptions nor idea of what our target would be. We also needed to make sure every decision was based on user feedback.
Keeping this print in hand was crucial in our ideation process.
should look like.
As a result, the majority of people will see clashing styles even among made by google widgets.
Apple is going to make a lot of jealous as they to create a tight set of rules to control the experience of its users. I think the widget party of Apple is going to be even bigger than the one android had in the past, just because it will make sense to see multiple widgets together.
My usage of the board on a long therm solo project

I came to a project with an idea but needed to make sure it was an existing problem. The research period was made of small sessions spread over 3 months.
This tool helped me remember what were my previous findings thorough the project.
Side note
If you would like to make sure your charts are good, you can check this article on “How to communicate with charts and graphics.”
They are probably other ways to get the same information and the same benefits from this tool. If you have a UX team and you are already used to print your interviews and stick them to the wall, you probably don’t need this.
I have designed this board to help with the issues I was facing in my research and I will integrate this solution in my workflow. It might be a good solution for you or it might not be. And it’s alright.
If you feel like this tool can be improved even further and could solve even bigger problems with a few tweaks, please do so! This is released as a Creative Commons which means it’s free to use, re-use and iterate from.
I will simply ask from you to let me know of your improvements and to think about me if you end up using it in its original version.